Good Pools and Bad Pools on Uniswap V3

Why are some pools good 🐶 and other pools bad 😈?
The answer comes from breaking down LP profits into:
- Price changes 📈
- Fees collected 🎟️
By comparing LPs to options, we discover parallel insights — let's explore!
Price changes
- ⬆️ Price up: positive return
- ⬇️ Price down: negative return
- ⤵️ Payoff determined by delta (Δ) & gamma (Γ) of LP position
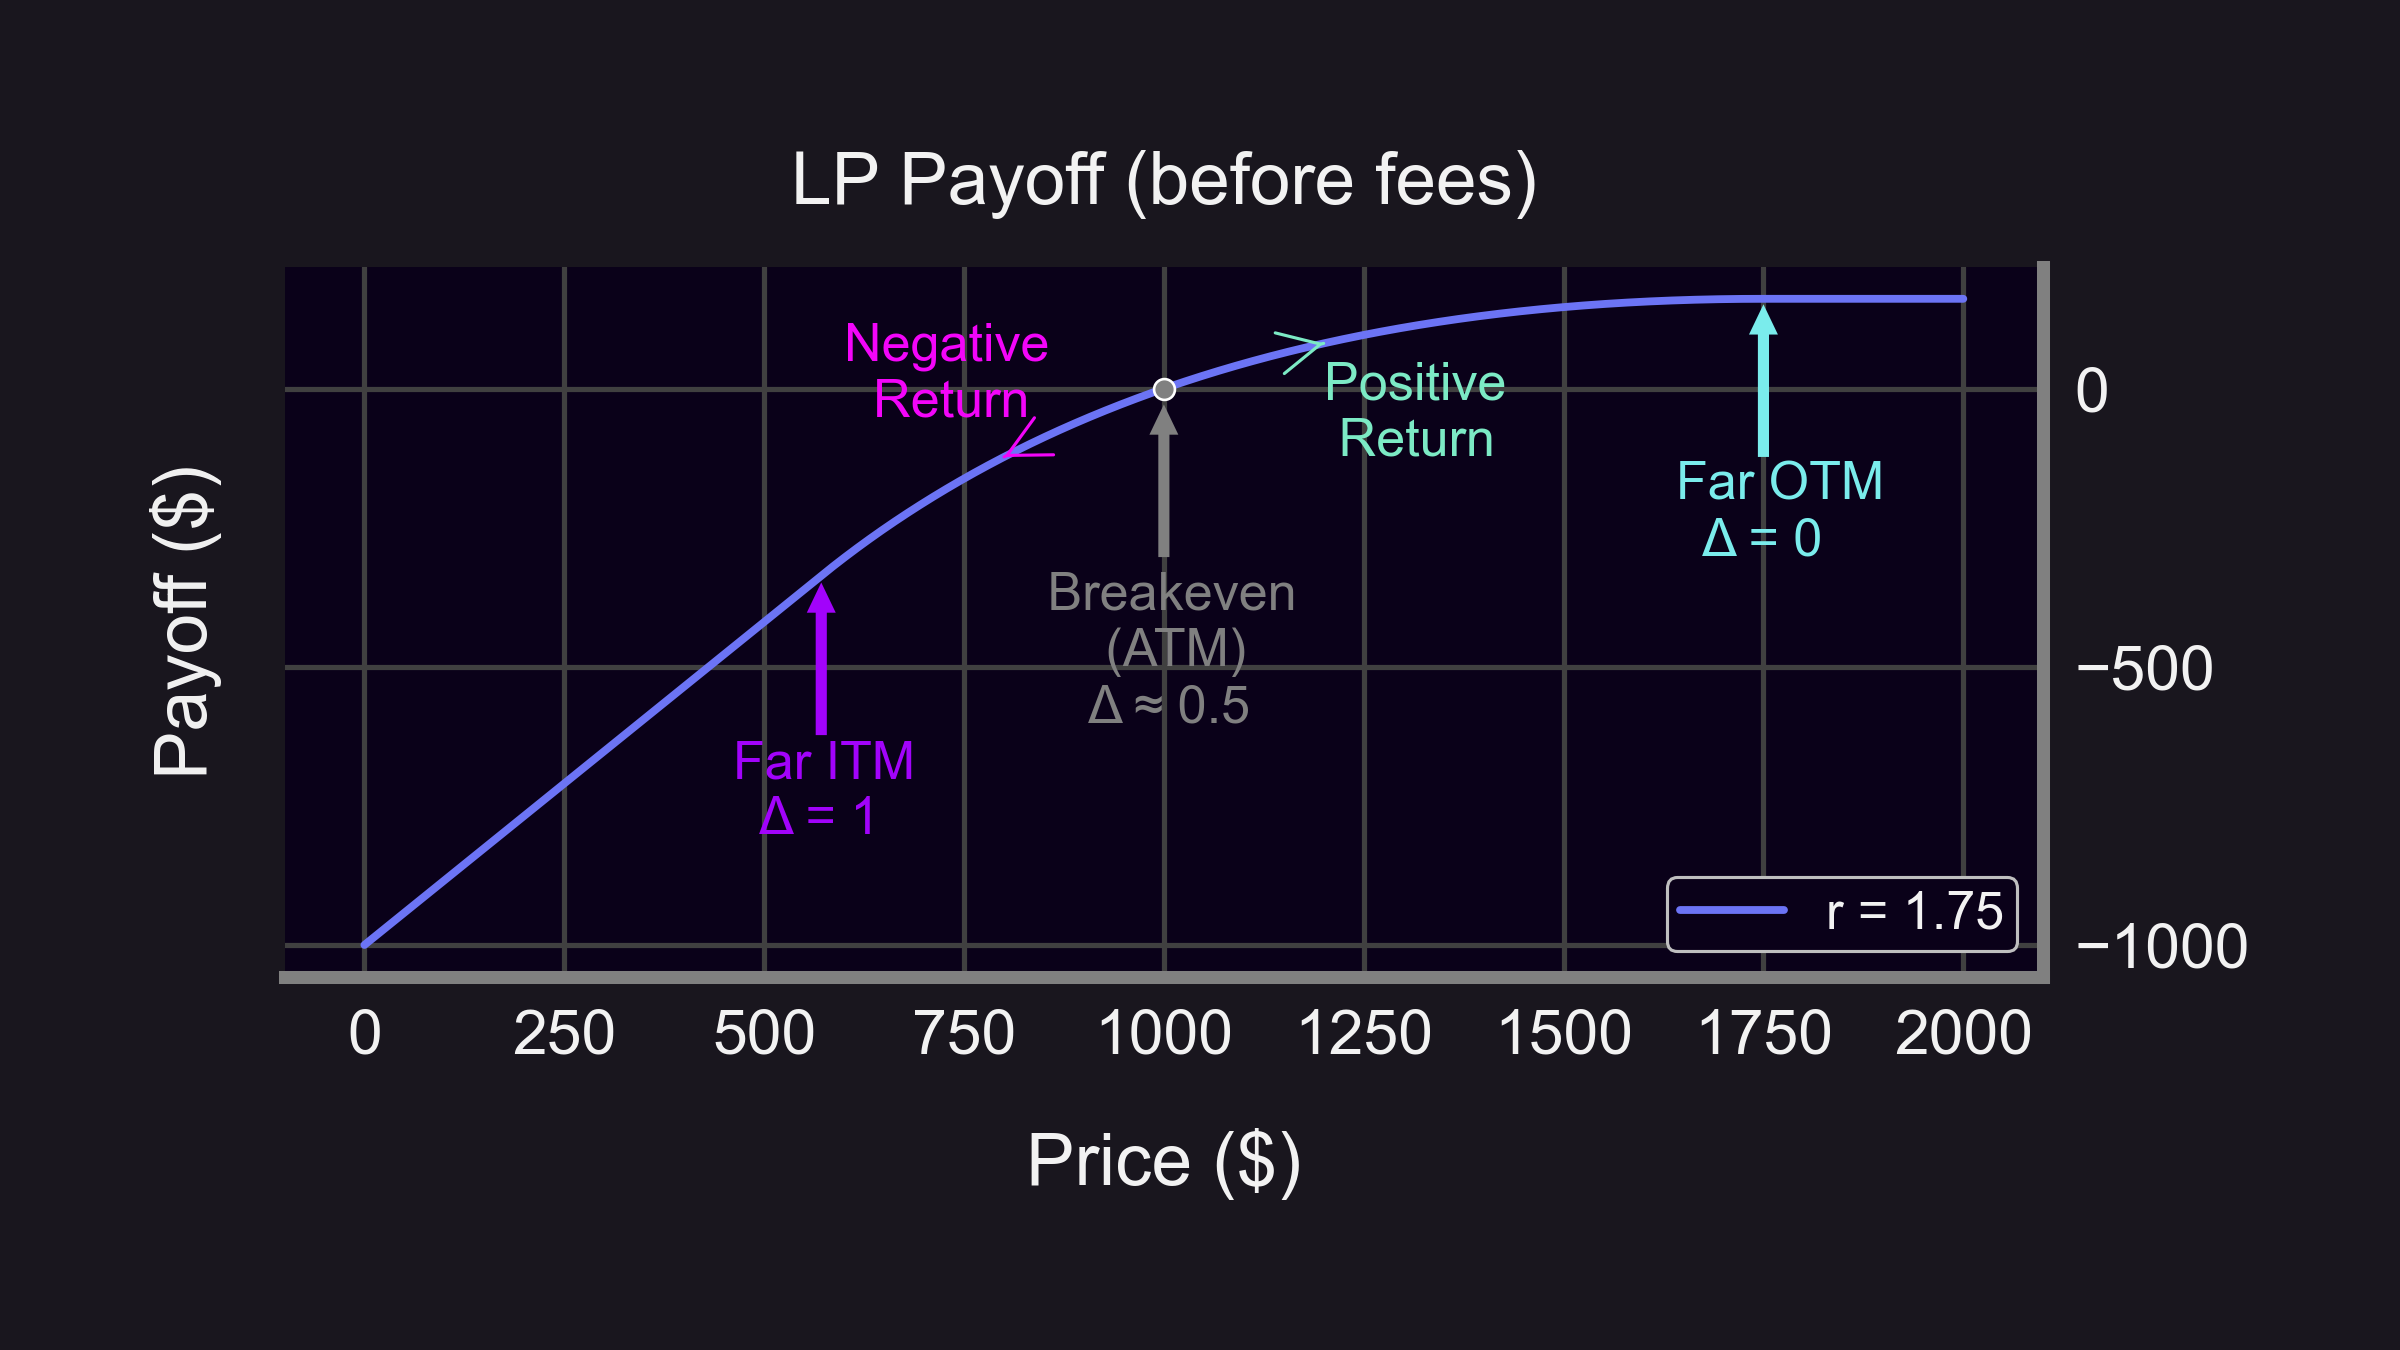
Why use options terminology (Δ & Γ) for LPs? Hint: that payoff looks awfully like a short put option!
Fees collected
Fees collected are determined by the theta (Θ) of the LP position.
🕒 Θ: Rate of time decay (dV/dτ)
💰 dV = fees collected
🧊 dτ = 1 block → Θ = fees per block 🤯
✅ Near the money: Θ > 0
❌ Far the money: Θ = 0

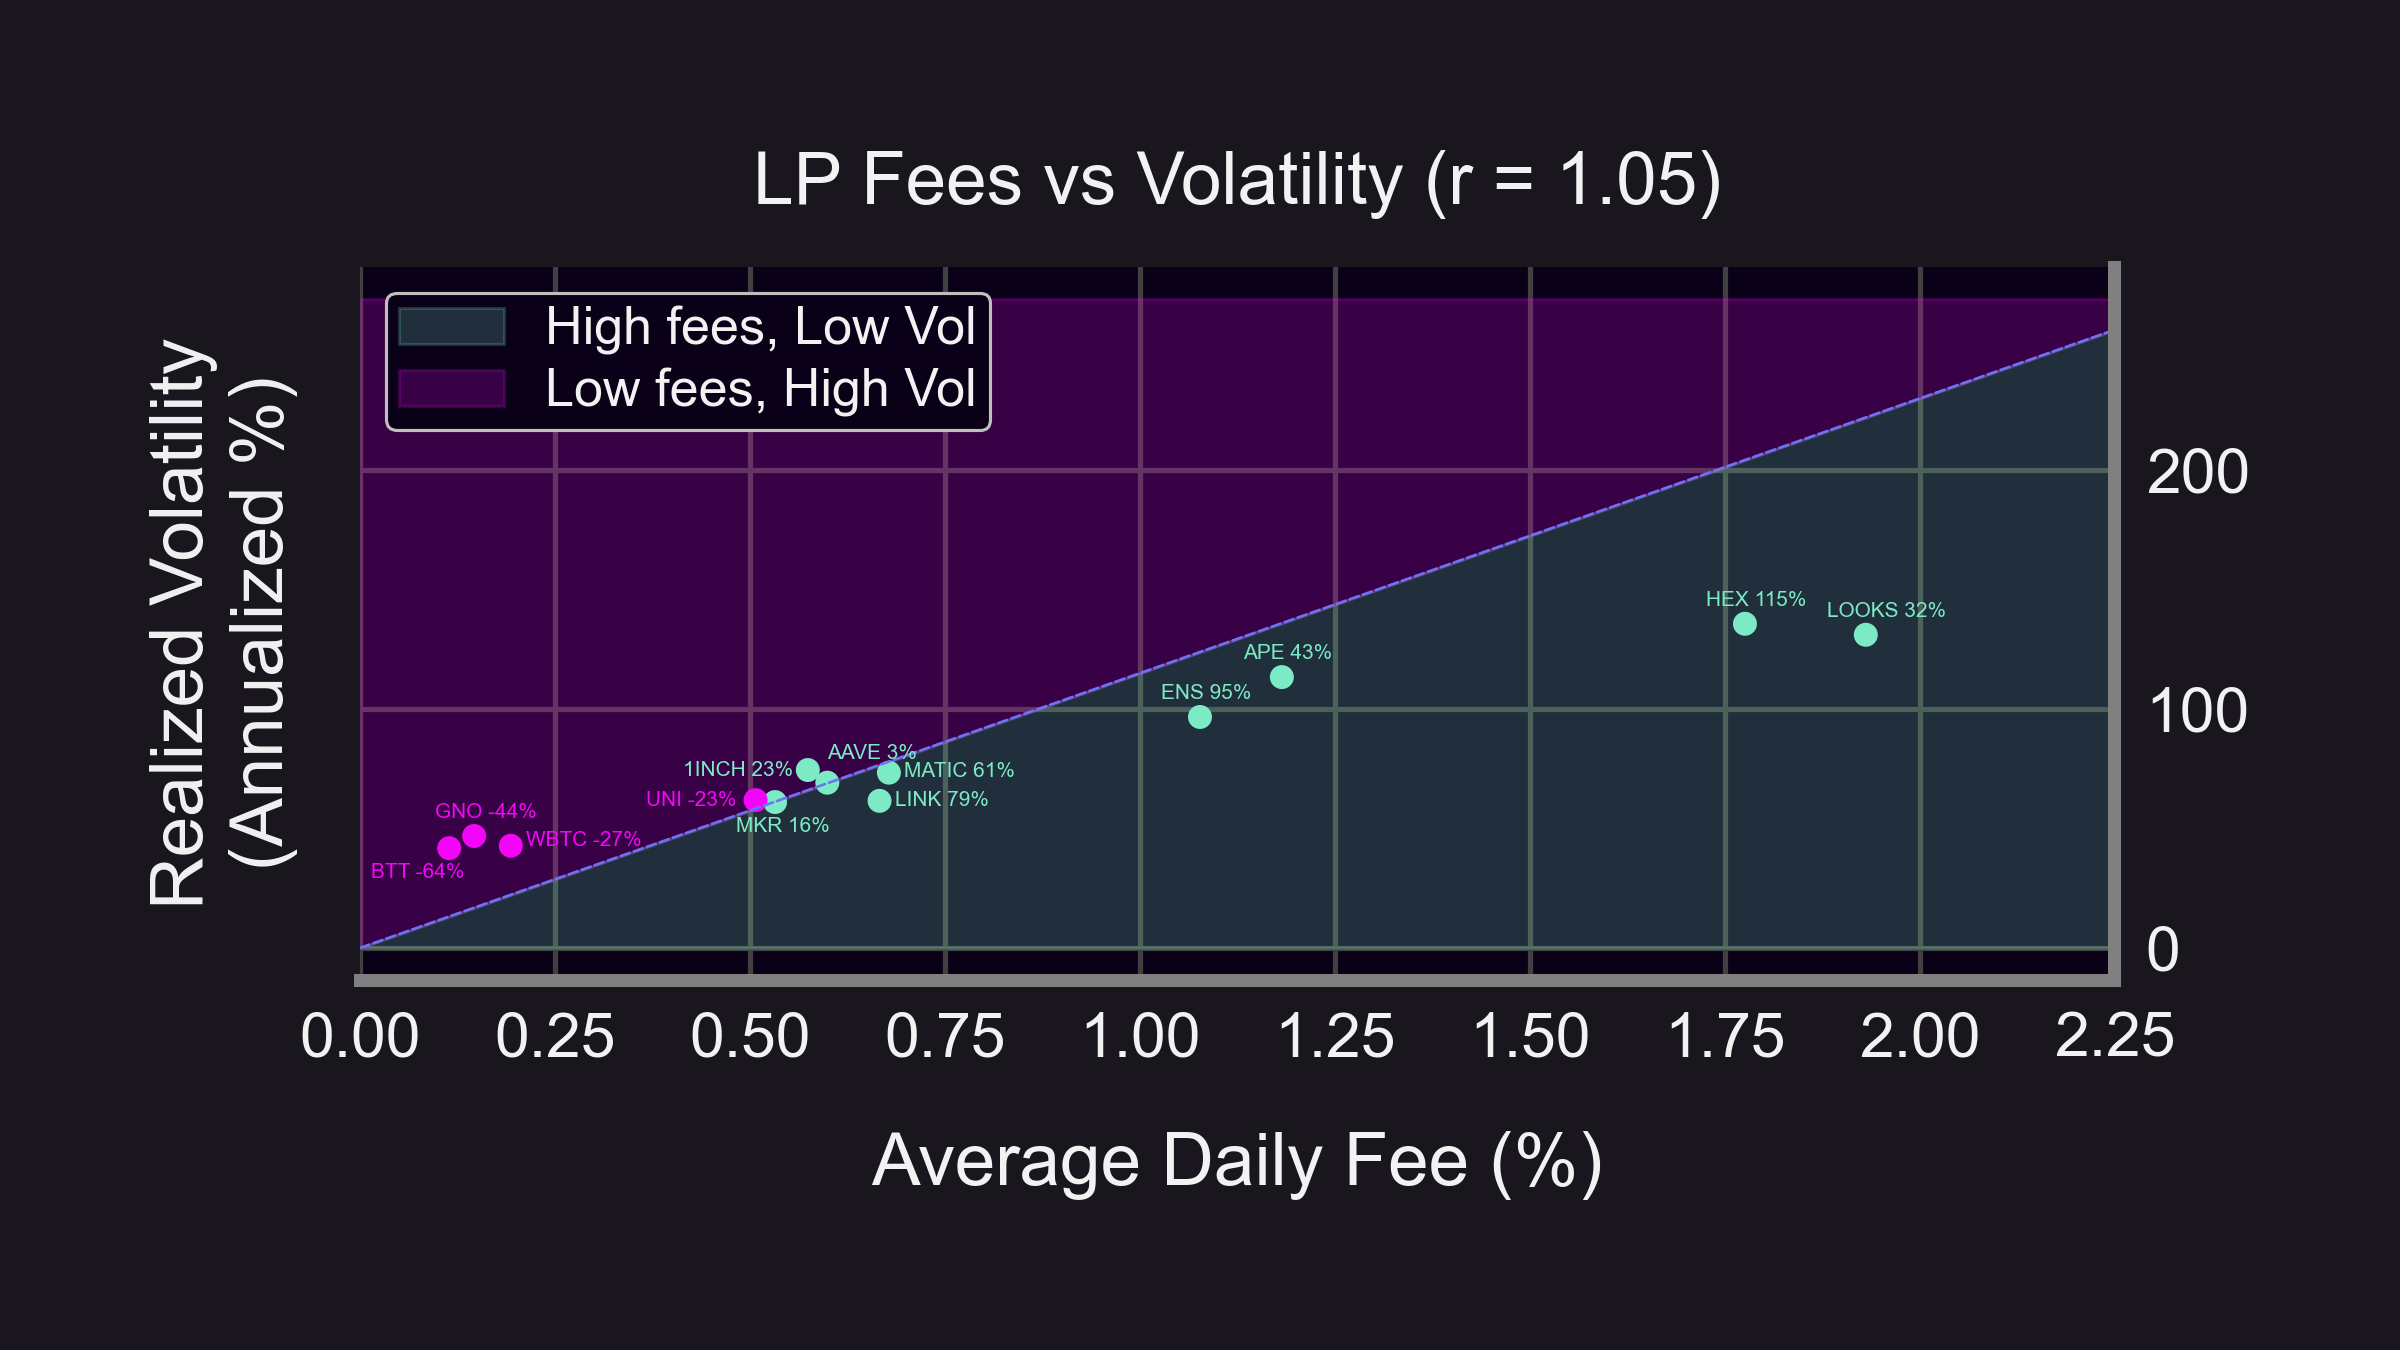
Implied Volatility vs. Realized Volatility
In TradFi, options selling is more profitable when Implied Volatility (IV) > Realized Volatility (RV). Can we compare IV-RV for LPs?
Yes! But let's use fees instead of IVs since:
- Easier calculation 🧮
- Fees collected ⇔ options premia 👇
- ⬆️ options premia ⇔ ⬆️ IV
Results match TradFi! 👇
- 🐶 Good pools (green dots): lie below the line, compensated by high fees given volatility ("IV > RV")
- 😈 Bad pools (pink dots): lie above the line, not compensated enough ("IV < RV")
(Dot values are summed returns from LPing)
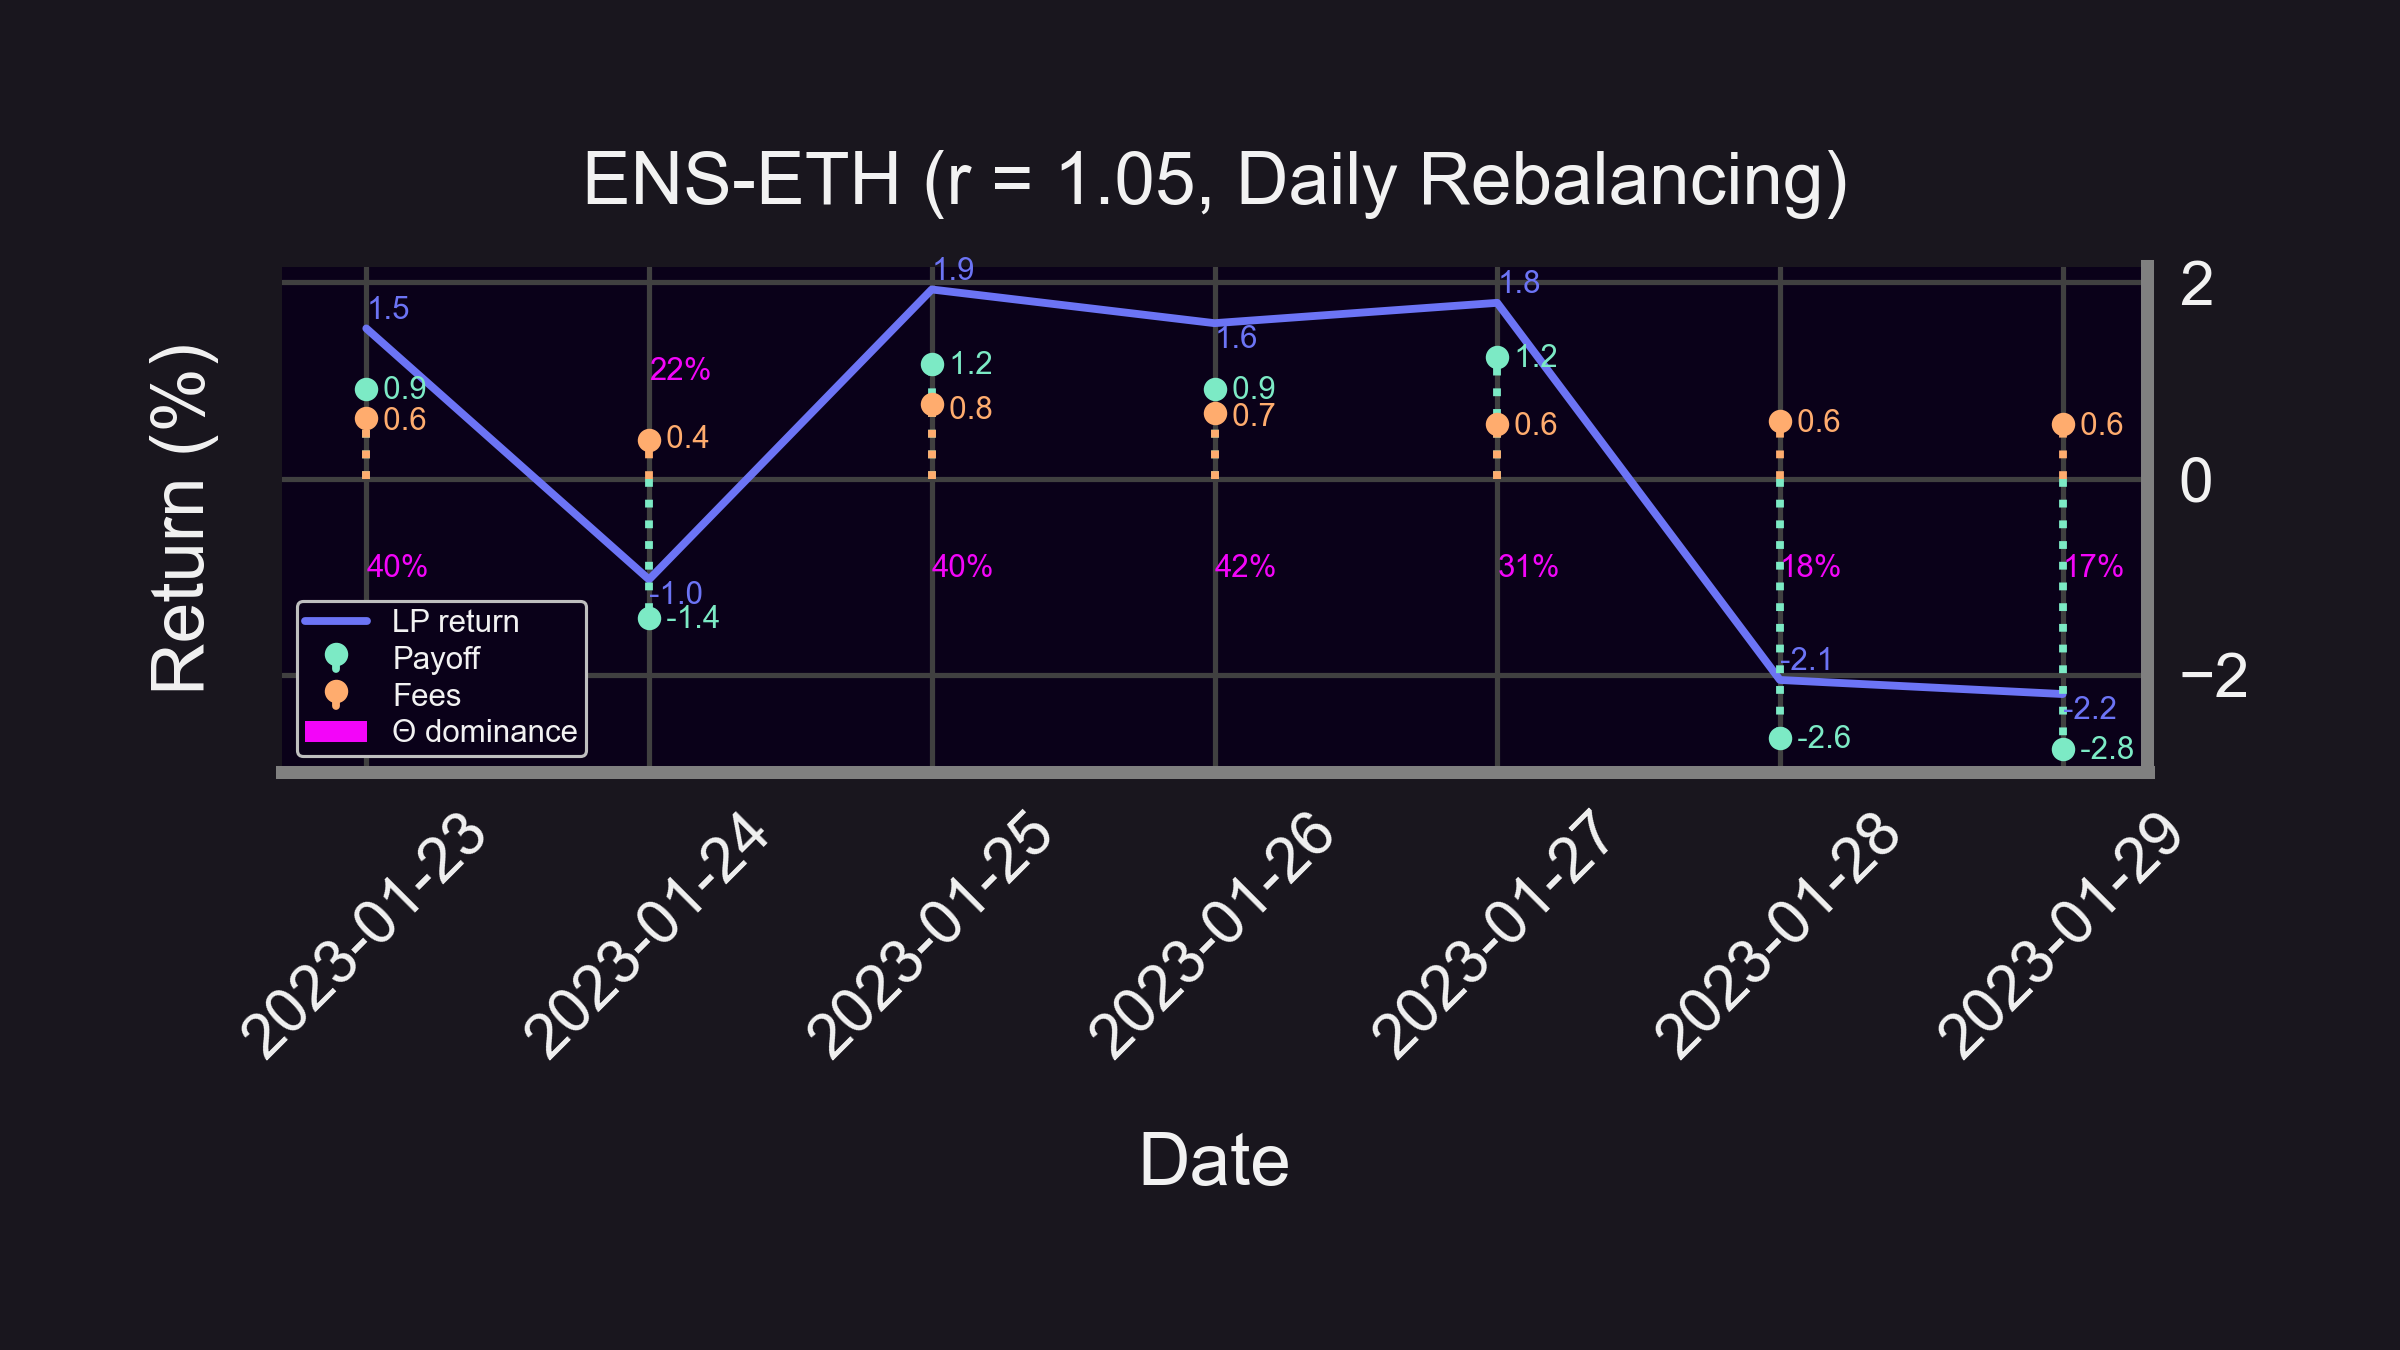
How do price changes and fees affect returns?
- ⬆️ Price → ⬆️ LP returns (since fees are always positive)
- ⬇️ Price → ⬆️ LP returns if Θ dominates
- ⬇️ Price → ⬇️ LP returns if Δ & Γ dominate
Let's define "dominance" so we can analyze pool returns! 👇
We define a metric to measure how much fees dominated LP returns:
(fees & payoff expressed as percentages)
Meaning:
- 💪 100% Θ dominance → fees drove 100% of LP returns
- 🤕 0% Θ dominance → price movement drove 100% of LP returns
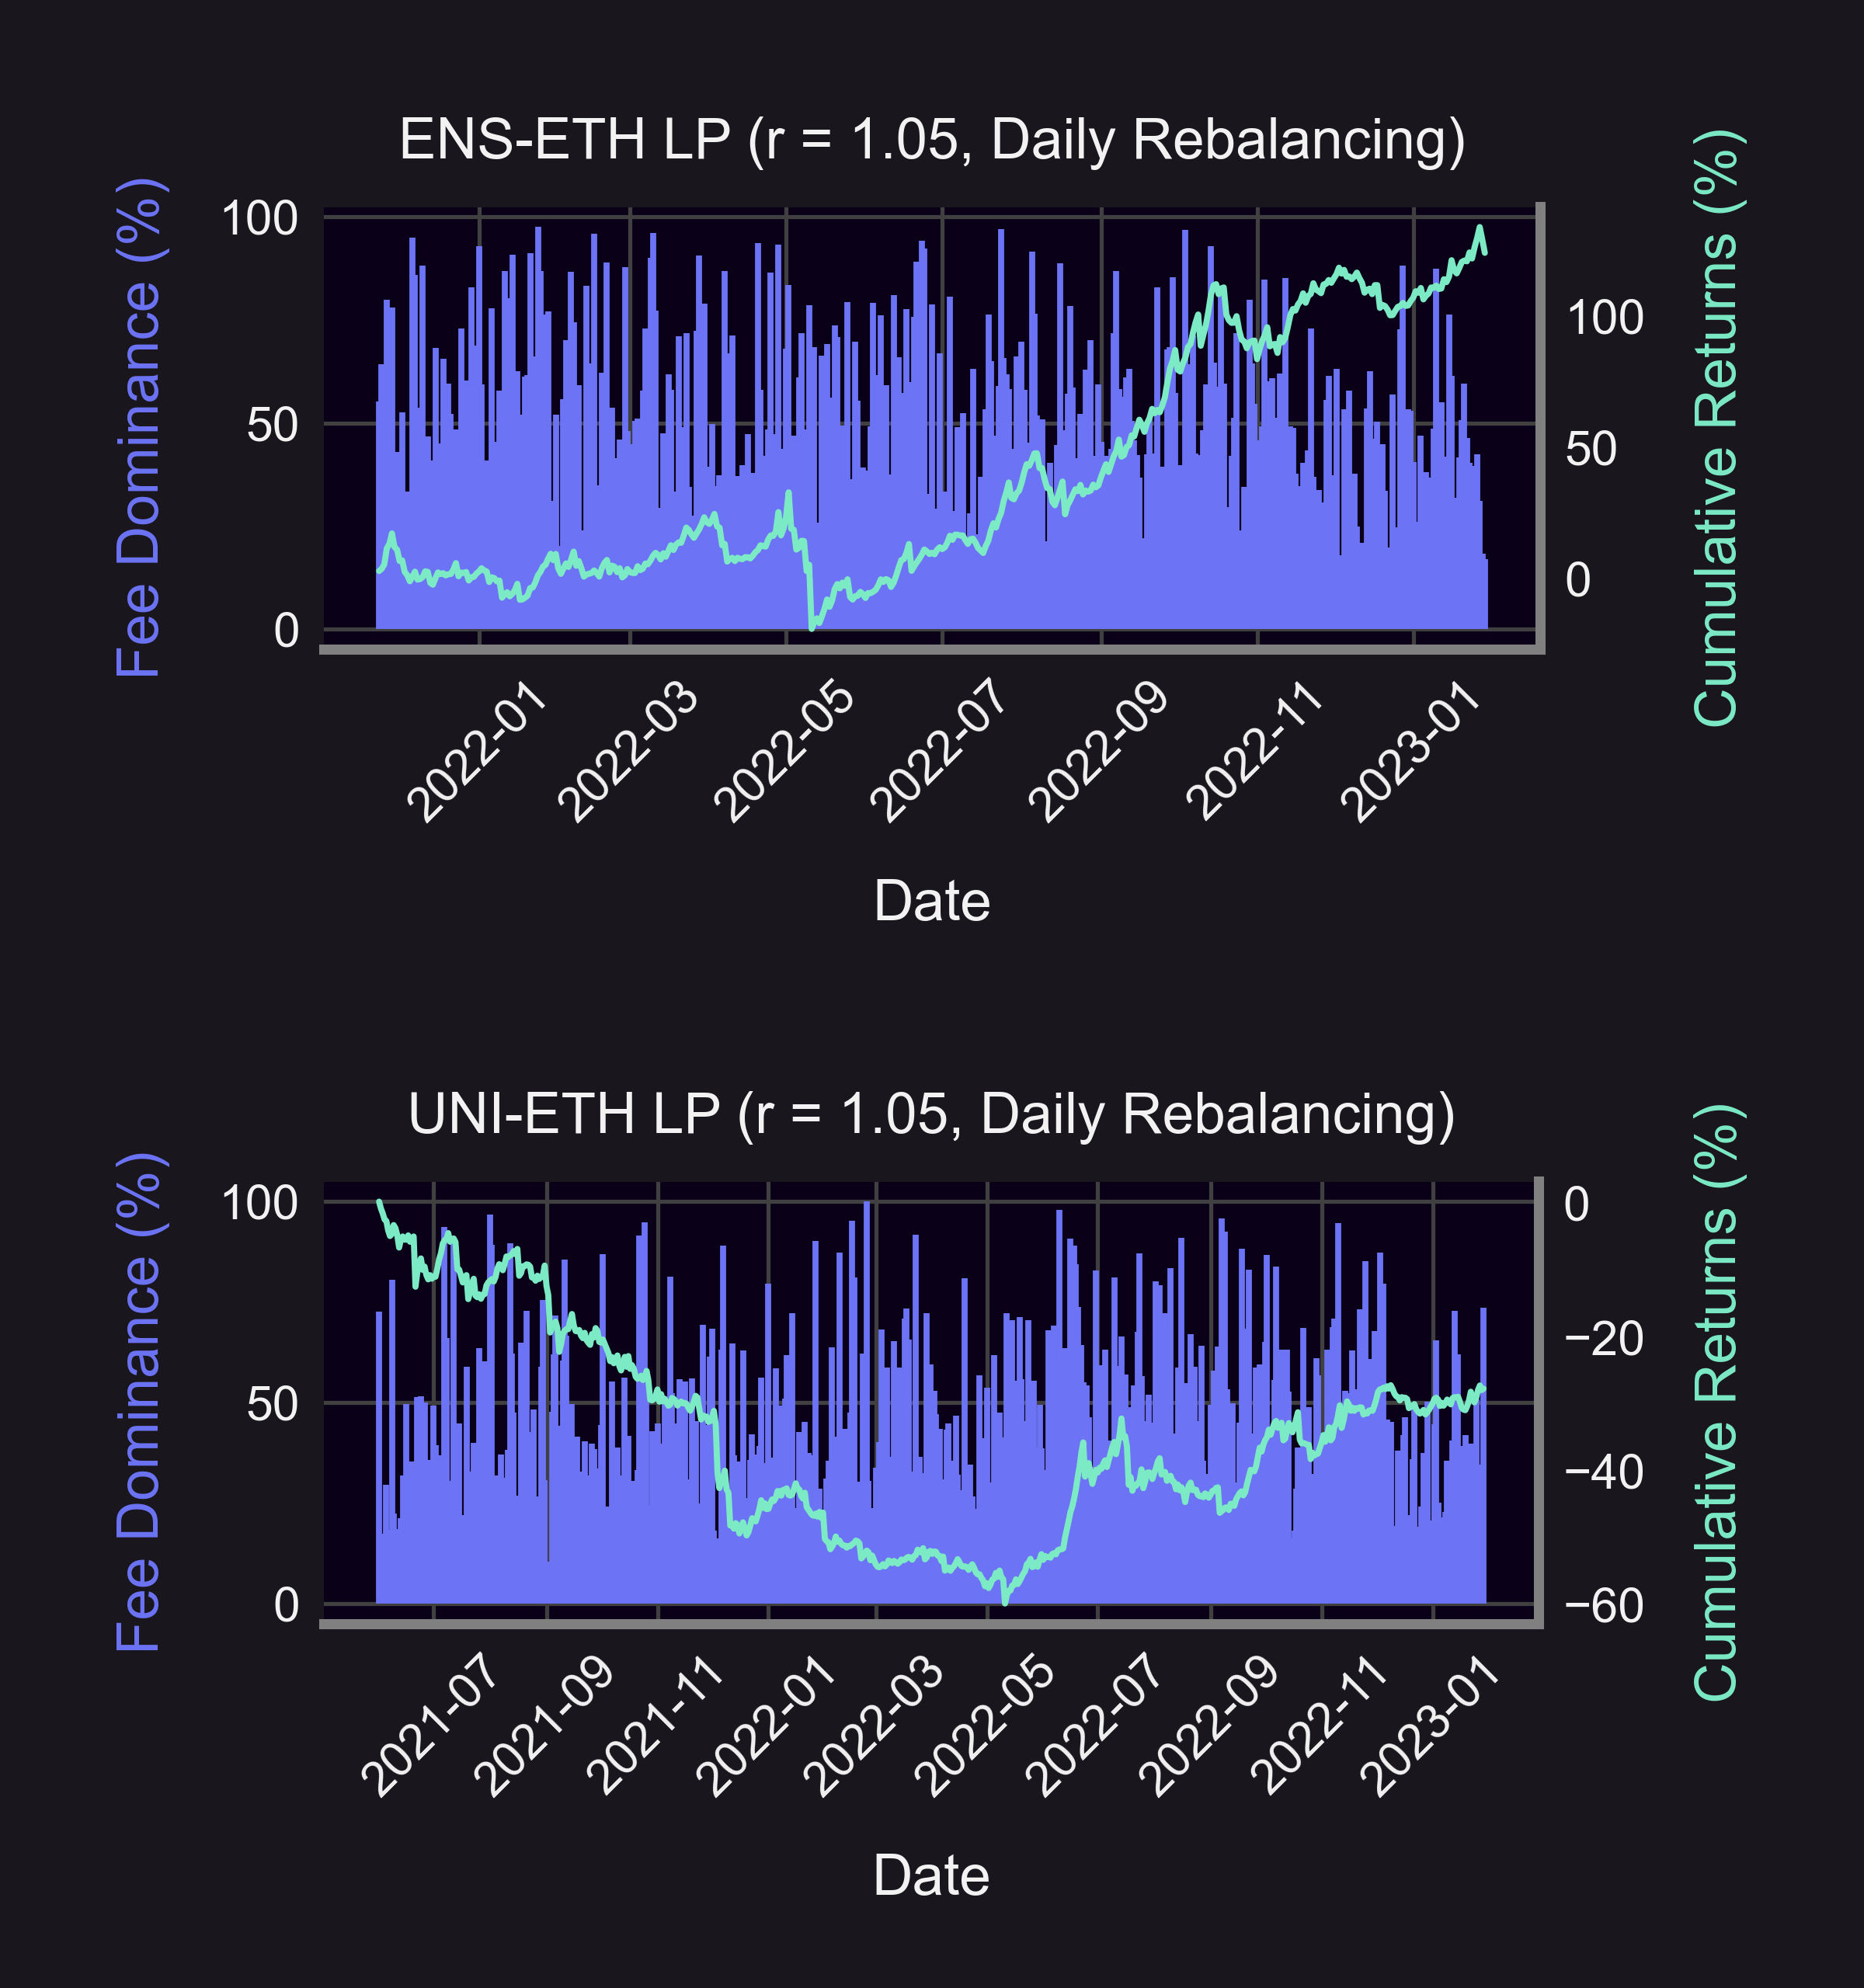
Previously, we found that LPing on ENS was highly profitable (+124%), but UNI was not (-28%). By graphing Θ dominance next to cumulative returns, we find:
- 😔 Bad days (negative returns) driven by price movement
- 🥳 Good days (positive returns) driven by fees
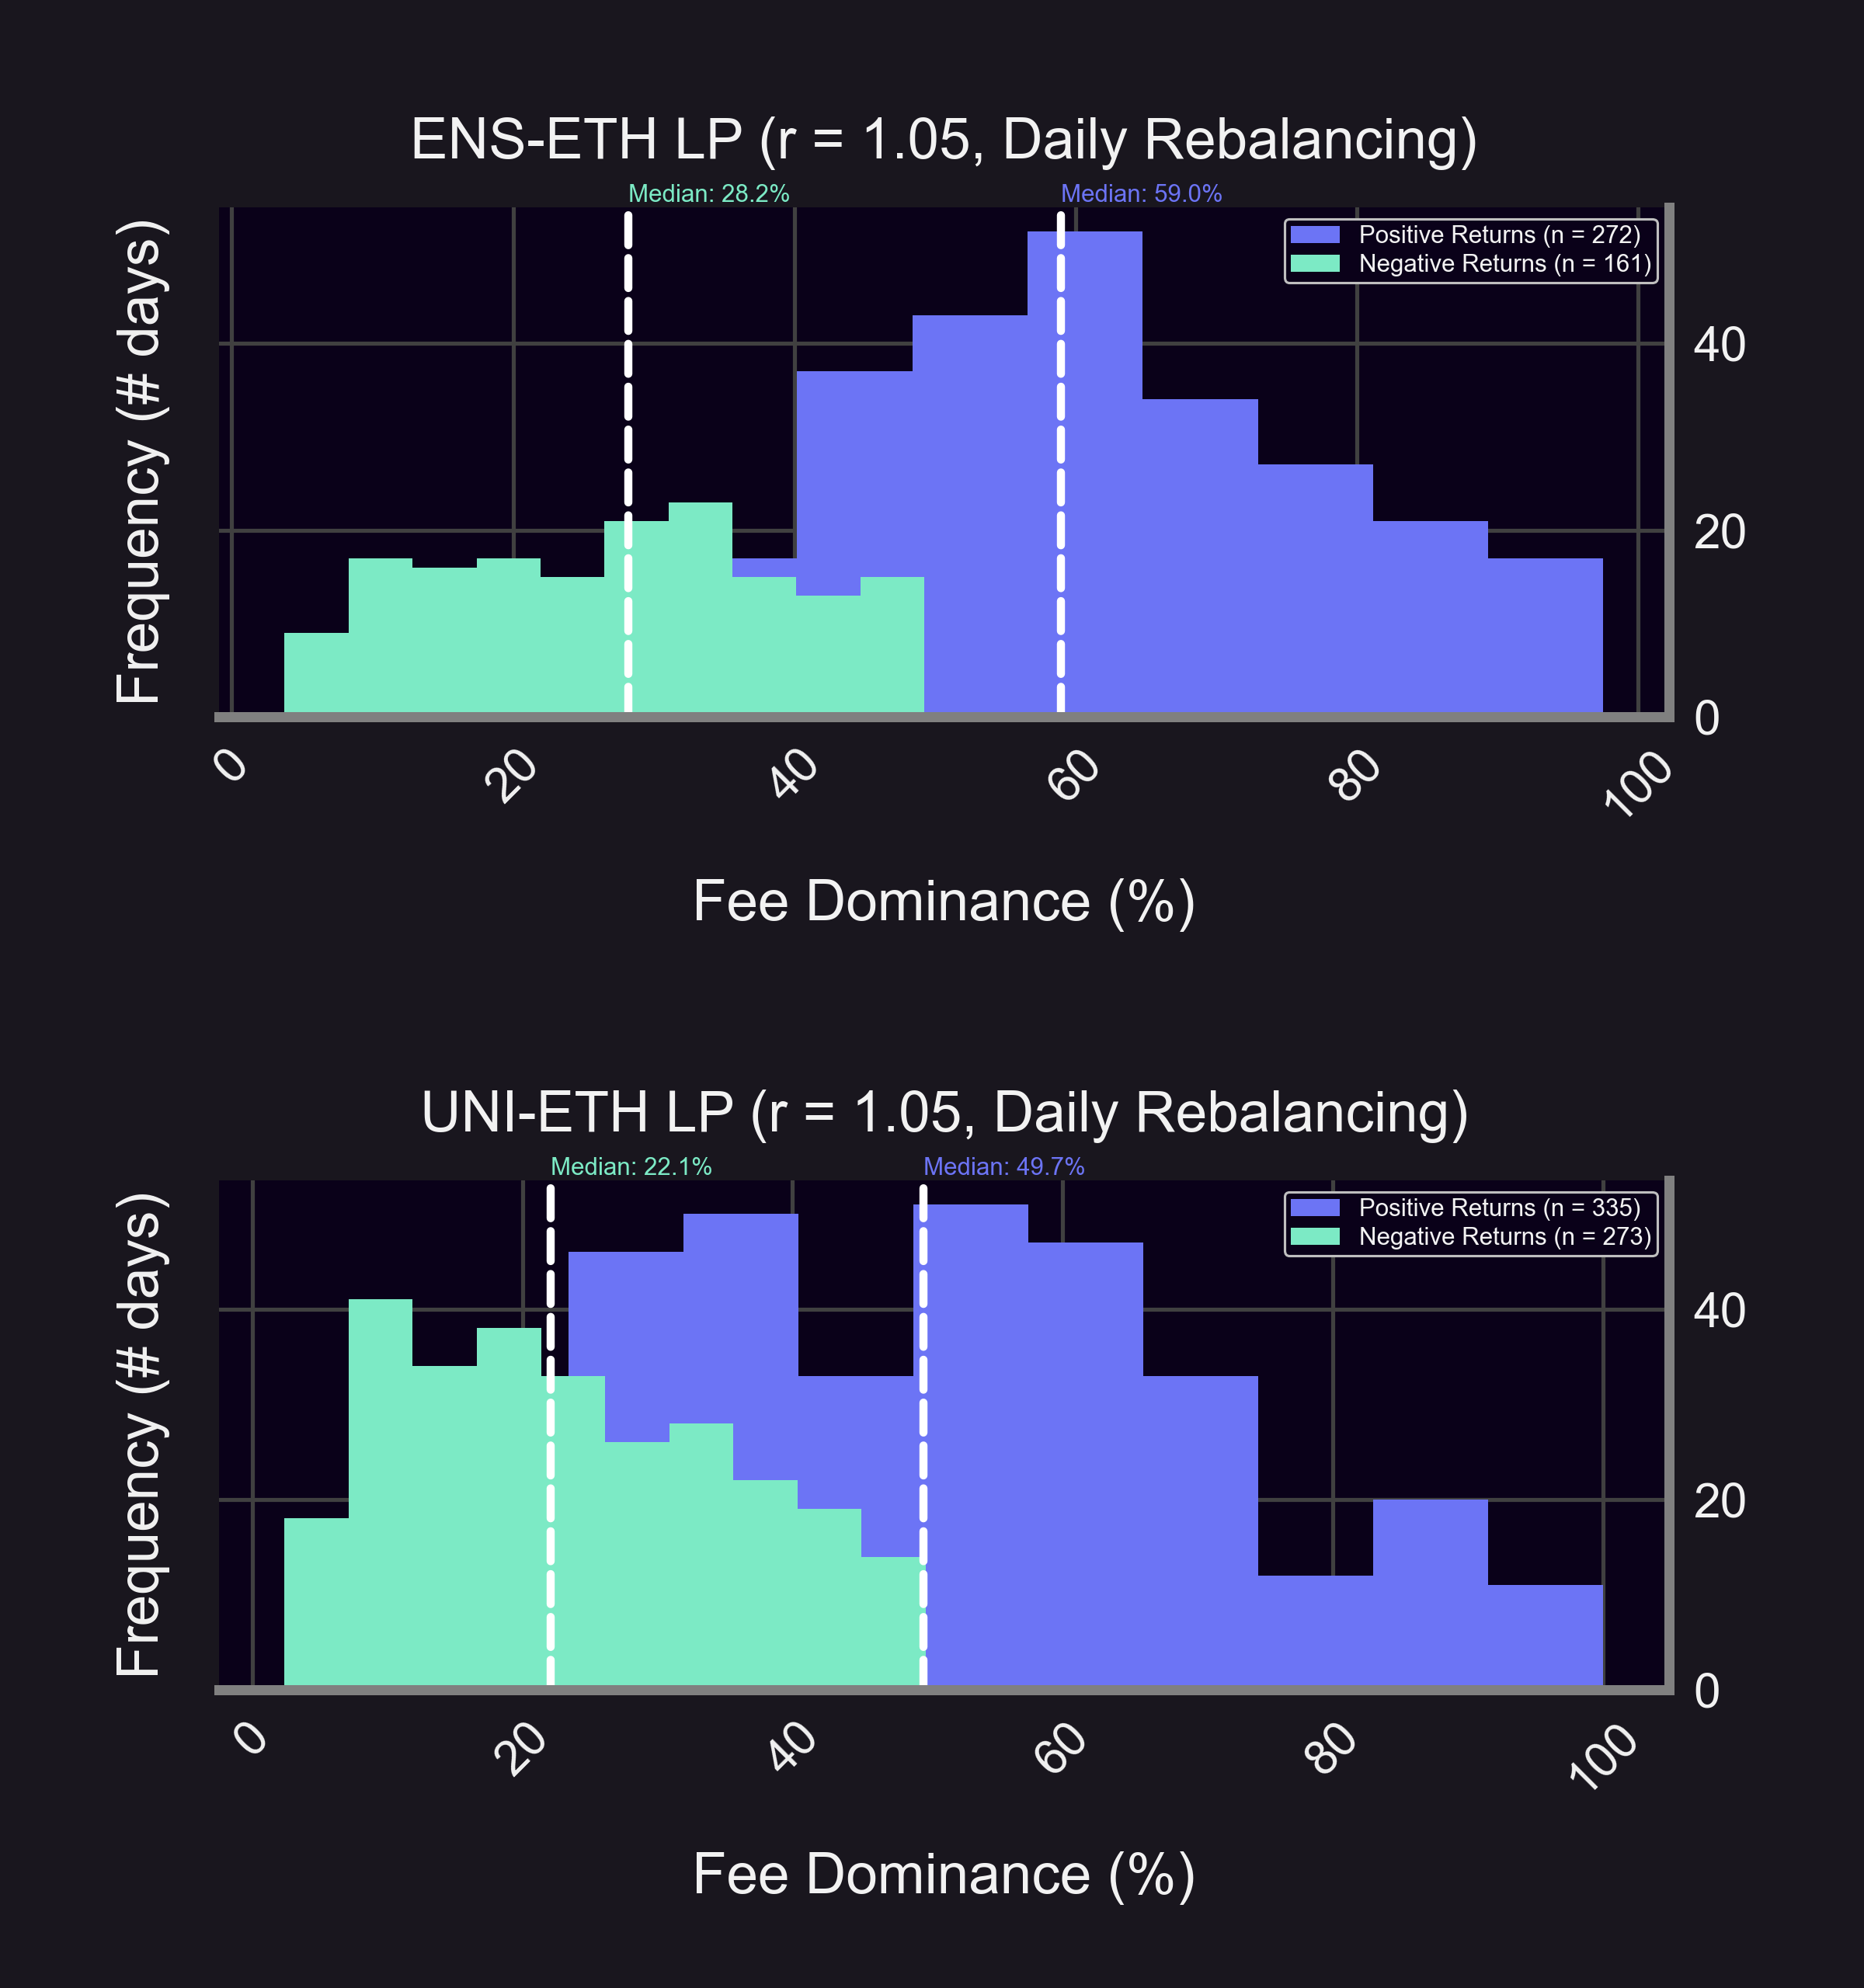
Breakdown of positive & negative returns confirms that good pool Θ dominance > bad pool Θ dominance:
- 😔Bad days: 28% (ENS) > 22% (UNI)
- 😊Good days: 59% (ENS) > 50% (UNI)
The good pool also had a higher proportion of good days:
- 🤩ENS: 63% (272/433)
- ☹️UNI: 55% (335/608)
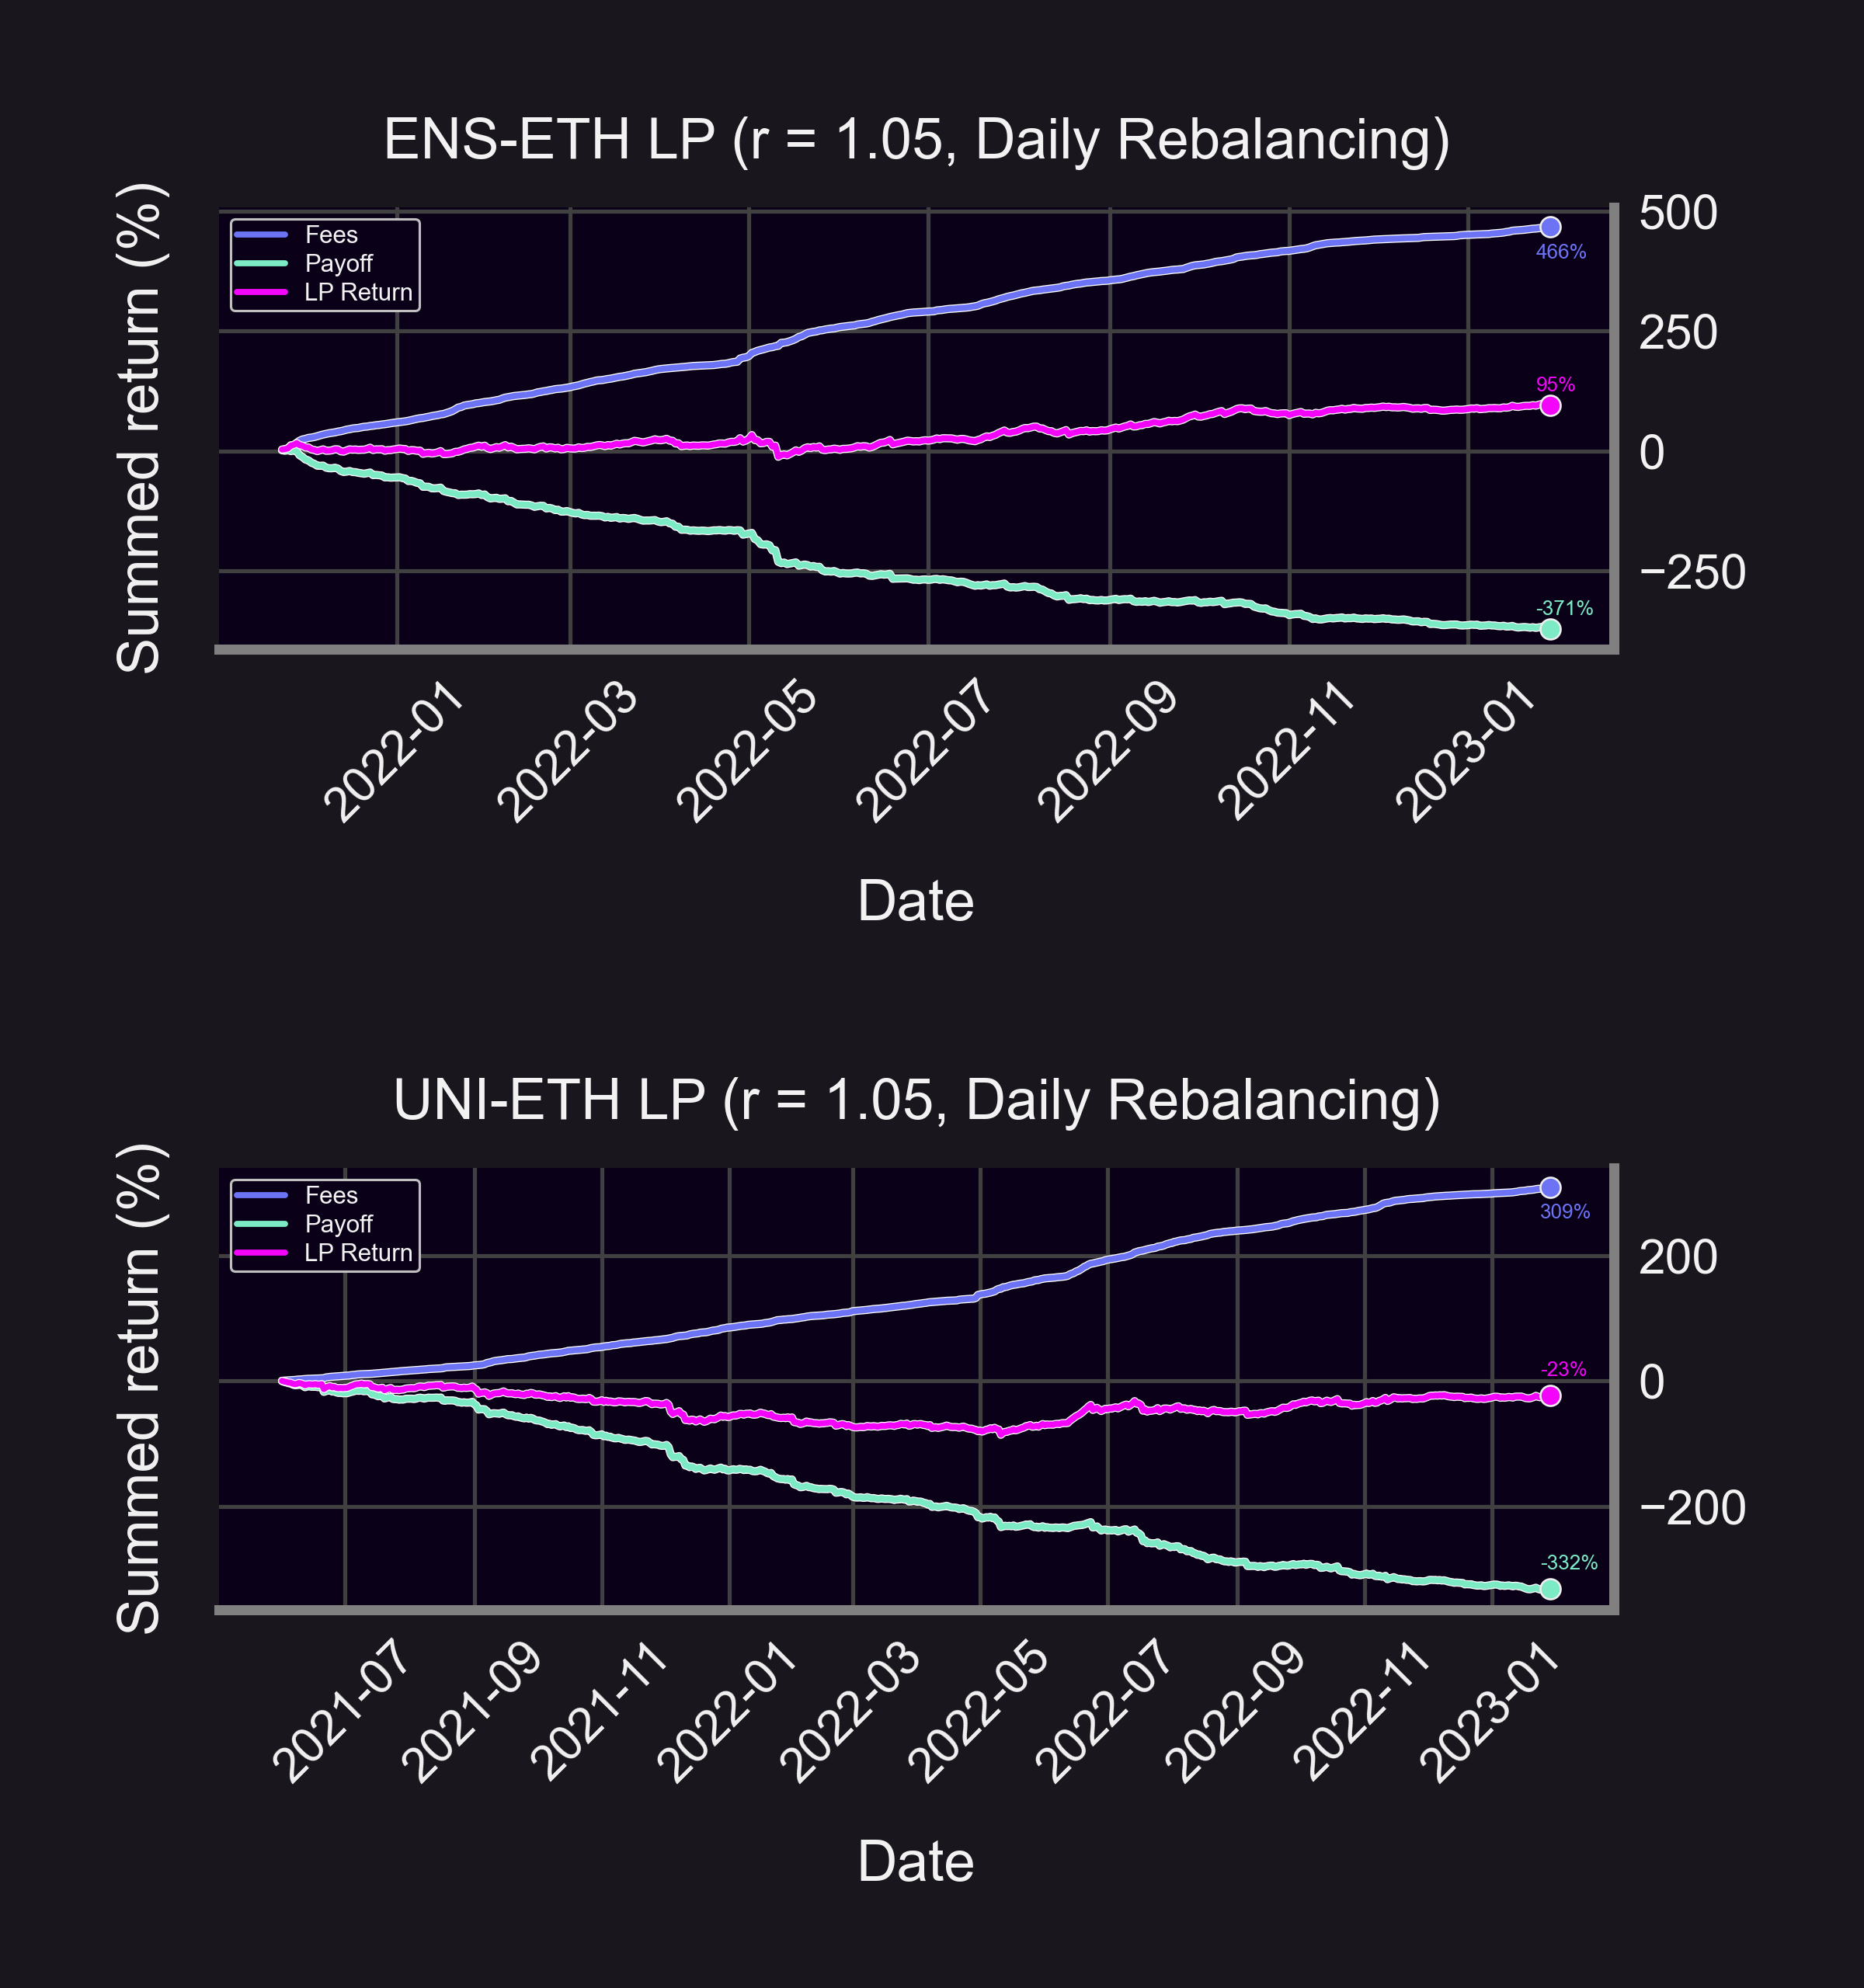
The good pool's fees made up for its bad payoffs (ENS):
- Fees: 466%
- Payoff: -371%
- Return: 95%
The bad pool's fees weren't enough to compensate (UNI):
- Fees: 309%
- Payoff: -332%
- Return: -23%
(All values are summed)
Summary
📣 Key Insights:
- LP = short option payoff
- Δ, Γ, and Θ affect LP returns
- LPs compensated when IV > RV
- Good days/pools driven more by fees than by price changes
Disclaimer:
- 📢 None of this should be taken as financial advice.
- ⚠️ Past performance is no guarantee of future results!